3:30 p.m. New York time
Half an hour before the closing bell. The S&P 500 futures has risen to 7185.75 during the session, a higher peak in the uptrend that began on March 30 from 6353.75. It then fell back slightly, to the 7150s.
Elliott Wave Theory: Wave D{-5} continues to rise, with no clear sign of completion. .
Decision Points: A continued move above today’s high at 7185.75 would confirm that wave D{-5} is still advancing. On the downside, a break below the recent support zone in the 7040s would be the first indication that the advance has ended and that wave E{-5} may be underway. Until then, the upward trend remains intact.
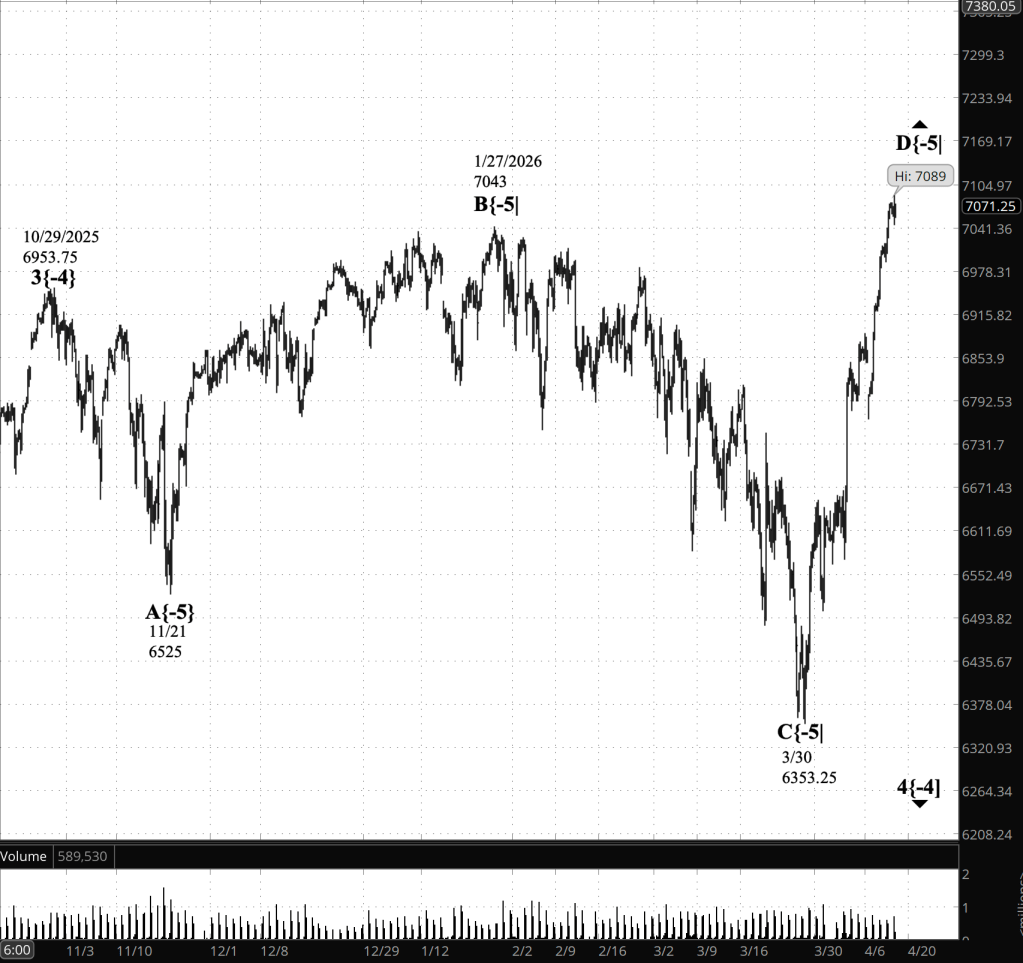
9:35 a.m. New York time
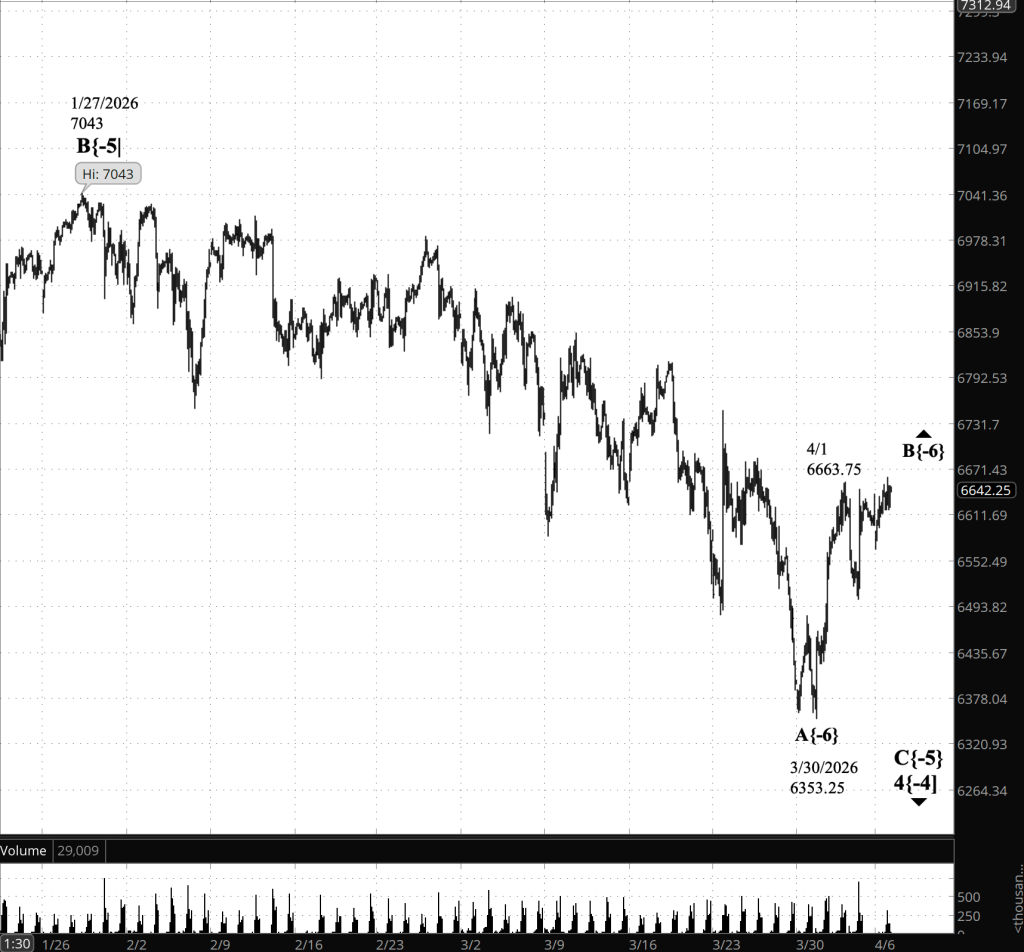
What’s happening now. The S&P 500 E-mini futures continued to rise overnight from yesterday’s session low at 7047.50, reaching into the 7130s.
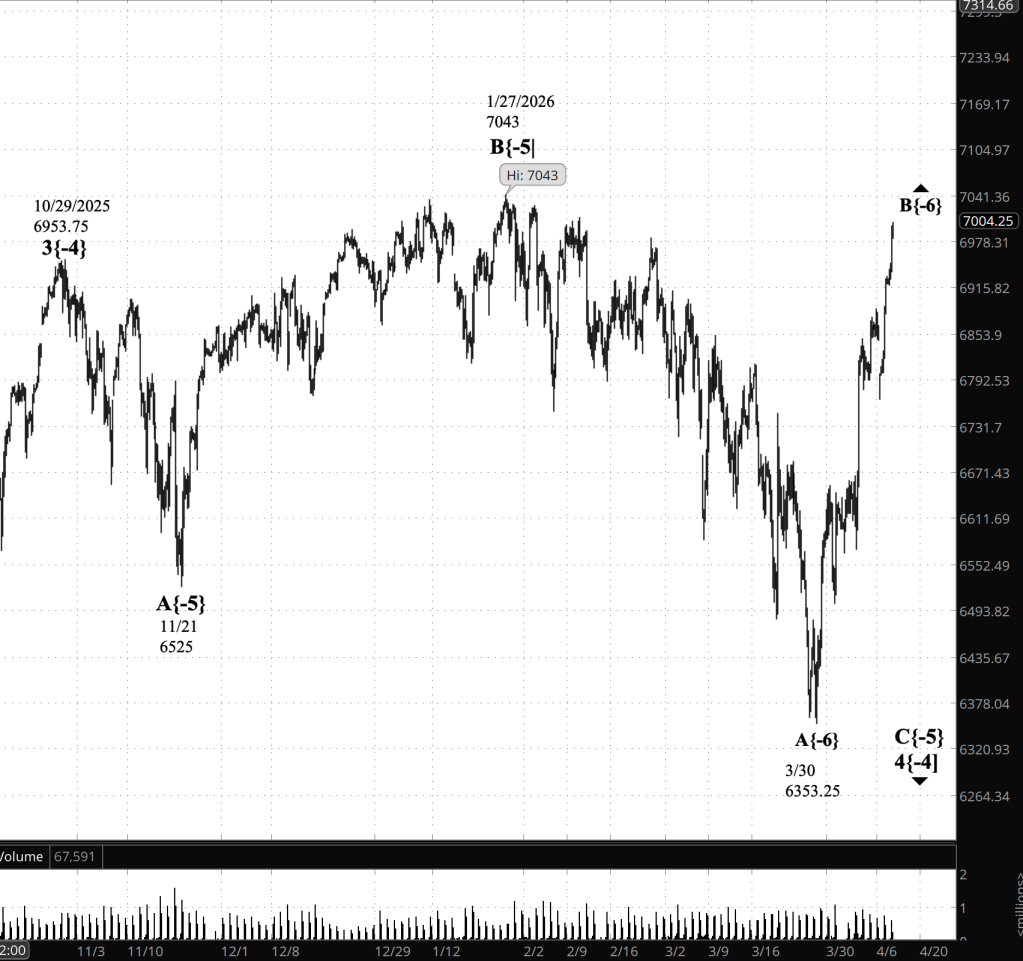
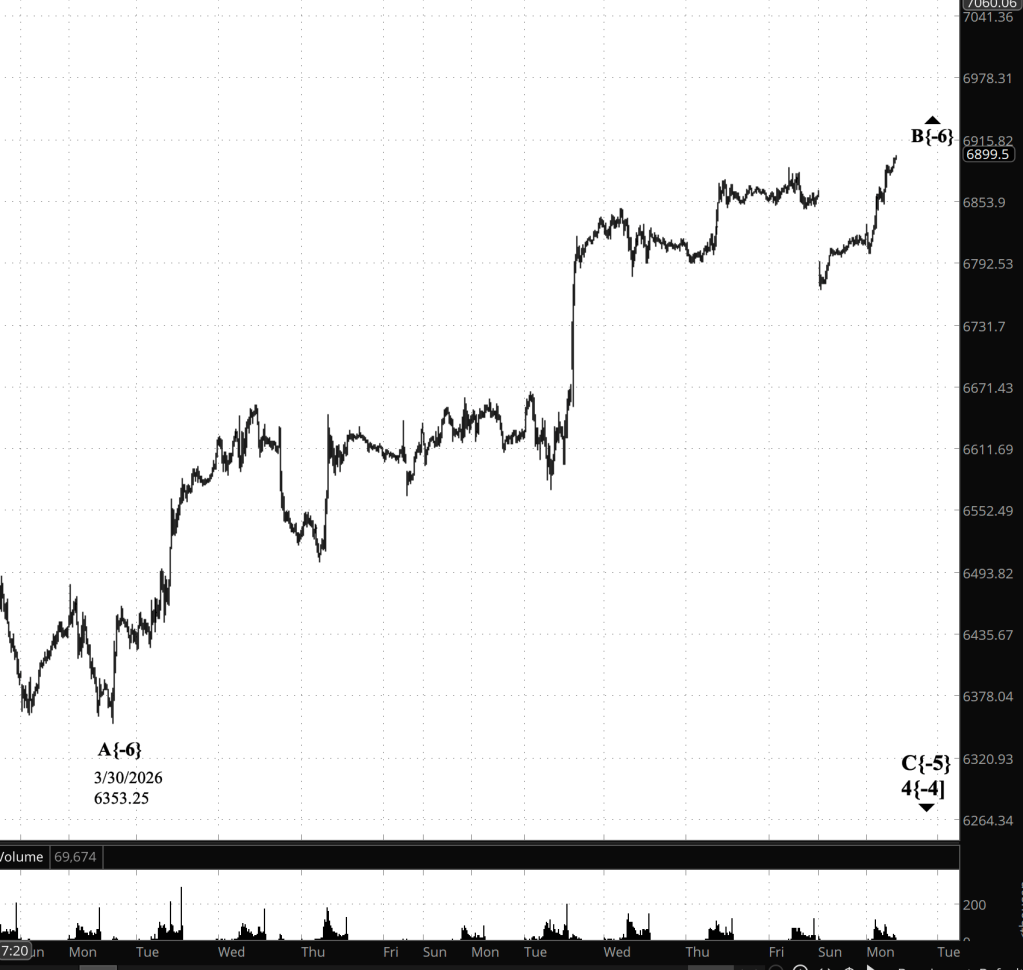
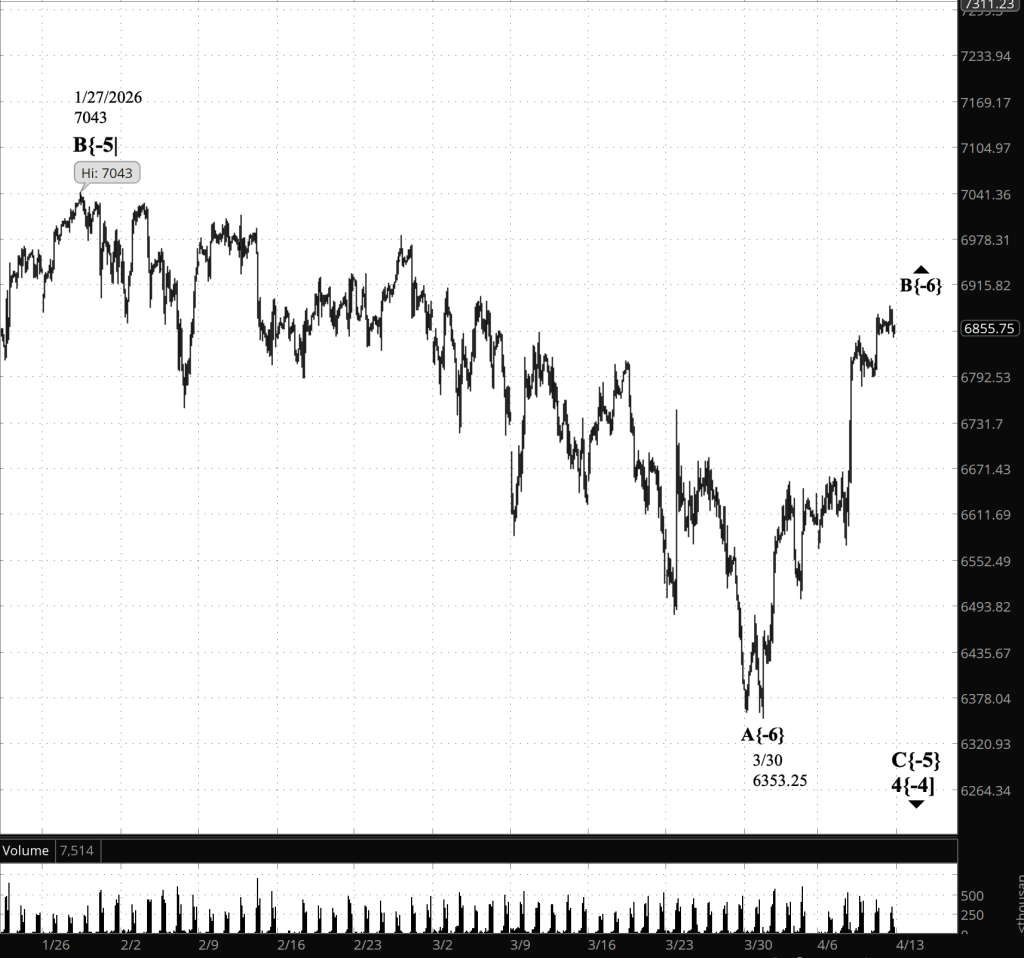
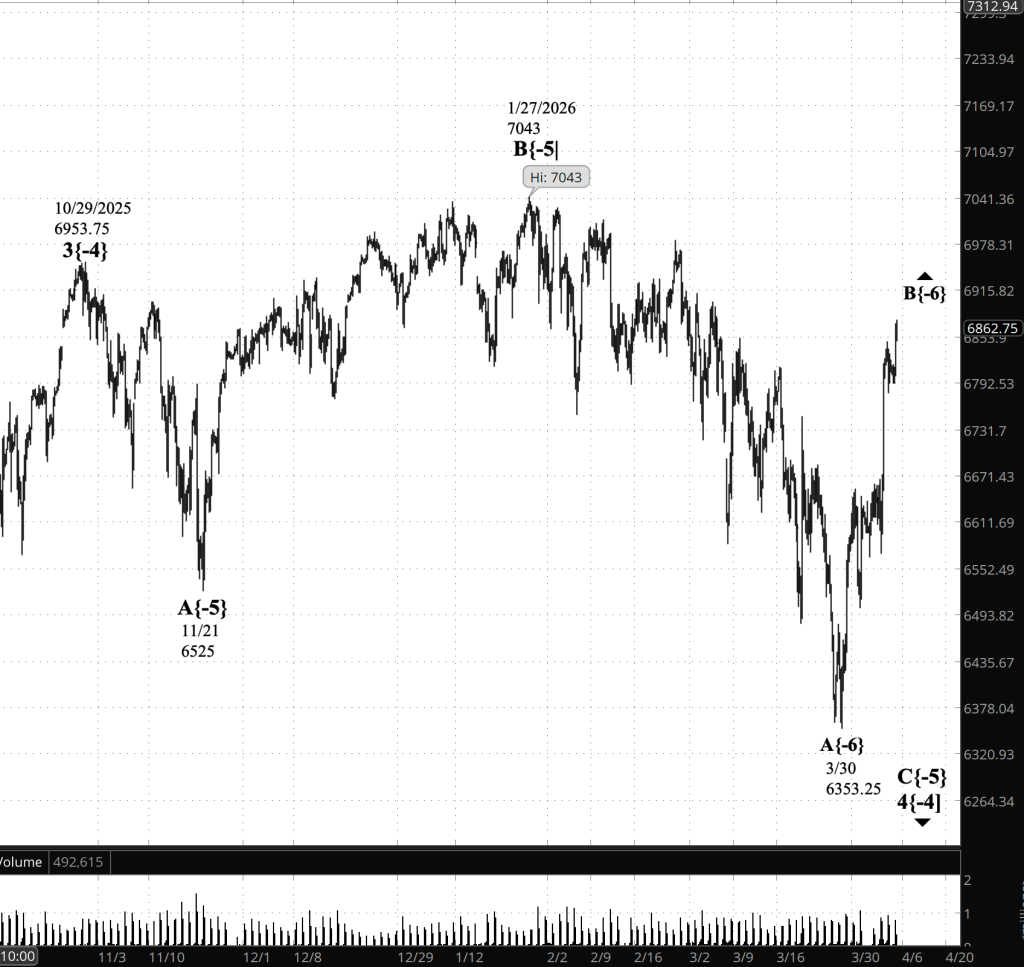
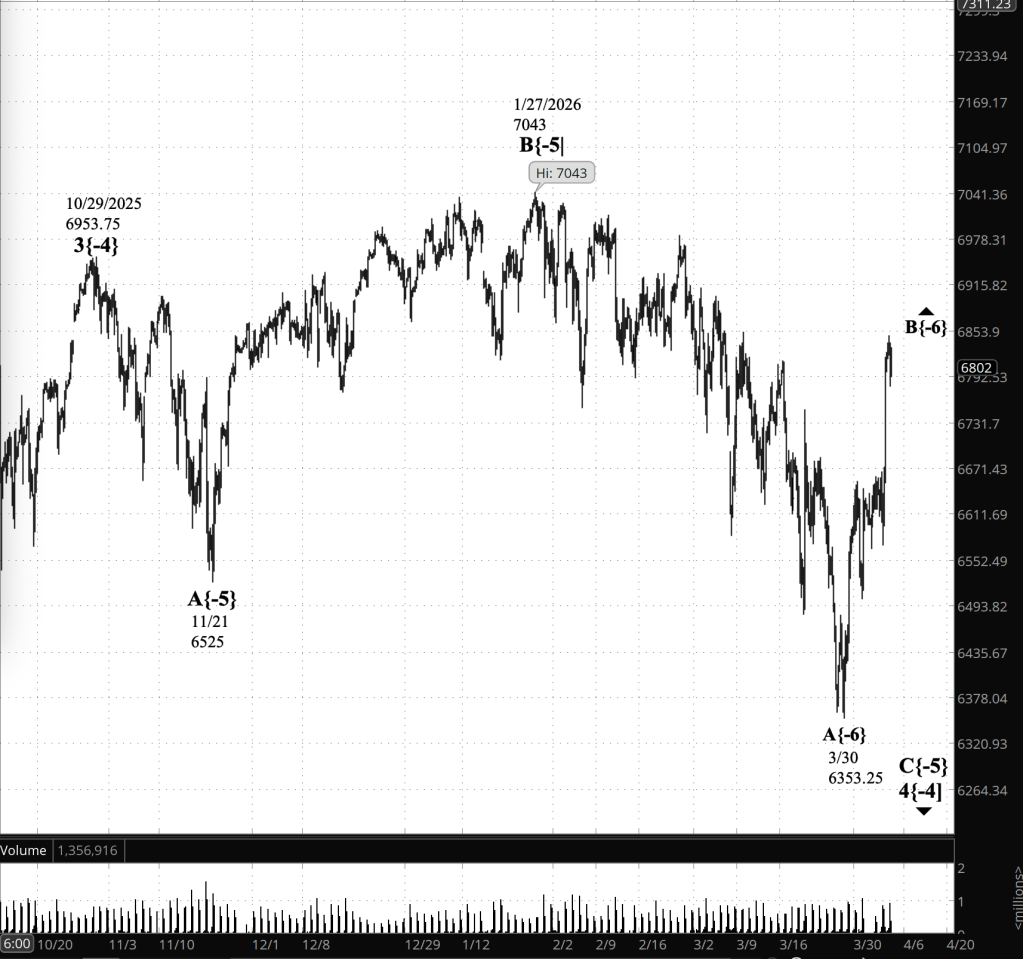
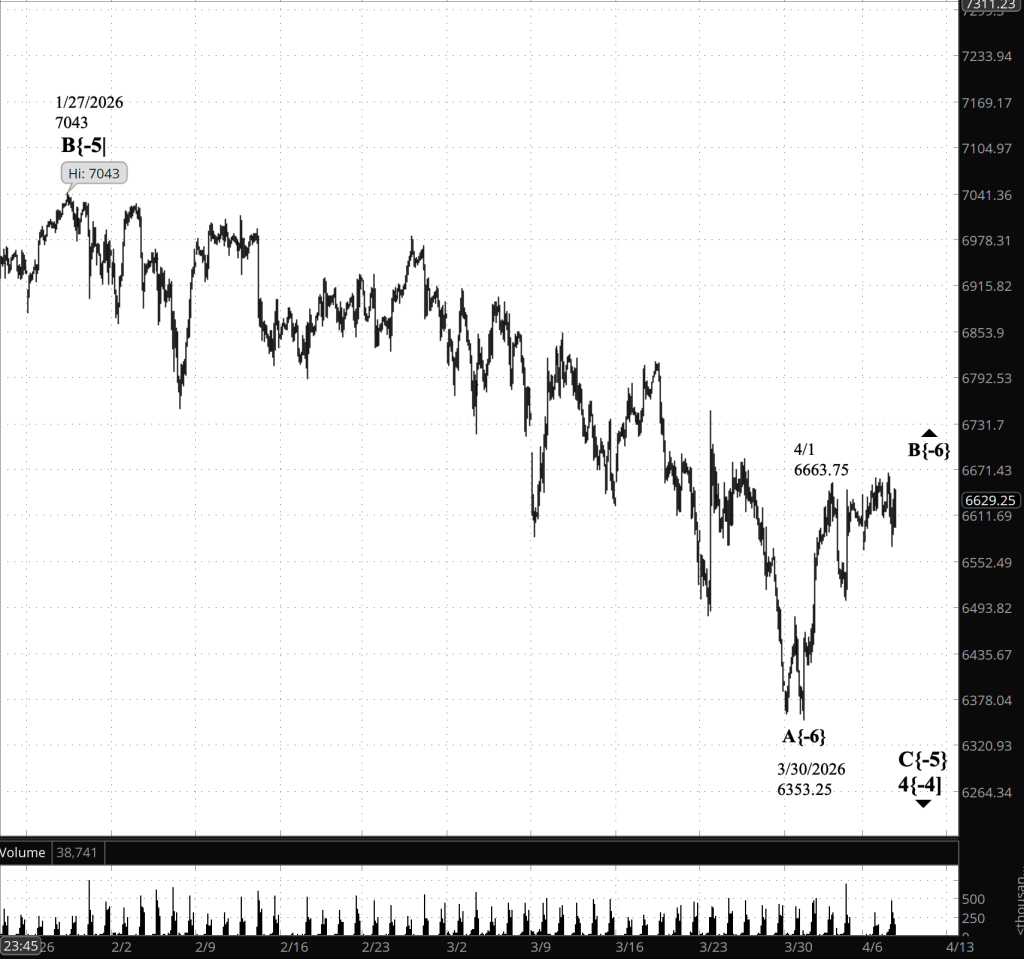
What does it mean? Elliott Wave Theory analysis continues to label the advance as wave D{-5}, the fourth subwave of an expanding triangle, wave 4{-4}, that began on March 30. In this formation, each subwave exceeds the extreme of the prior wave moving in the same direction.
Each subwave subdivides into three waves. The current advance has been strong enough that its internal structure lacks clarity at lower degrees. Tentatively, the rise appears to be in wave C{-6}. If that labeling holds, completion of C{-6} would also complete D{-5}, setting the stage for declining wave E{-5}.
An alternate interpretation remains viable: the entire advance from March 30 could instead be a larger wave A{-6}. At present, price action has not forced a distinction between these counts.
Decision Points. The immediate question is whether the current rise is nearing completion as wave D{-5}, or whether it is part of a larger and still-unfolding advance.
On the upside, a sustained move above 7147.50 — the current overnight high — would argue that wave D{-5} is still extending, with no clear sign yet of a transition into wave E{-5}. Continued strength above that level keeps the upward path open.
On the downside, a break back below 7047.50 — yesterday’s session low and the start of the latest leg up — would be the first indication that the advance has ended and that wave E{-5} may be underway.
From a broader perspective, failure to produce a clear three-wave structure at lower degrees, combined with continued upward extension, would increasingly favor the alternate count: that the entire move is a larger wave A{-6}, not a subwave within a triangle.
Until one of these levels is decisively exceeded, the market remains within the ambiguity typical of late-stage triangle development.
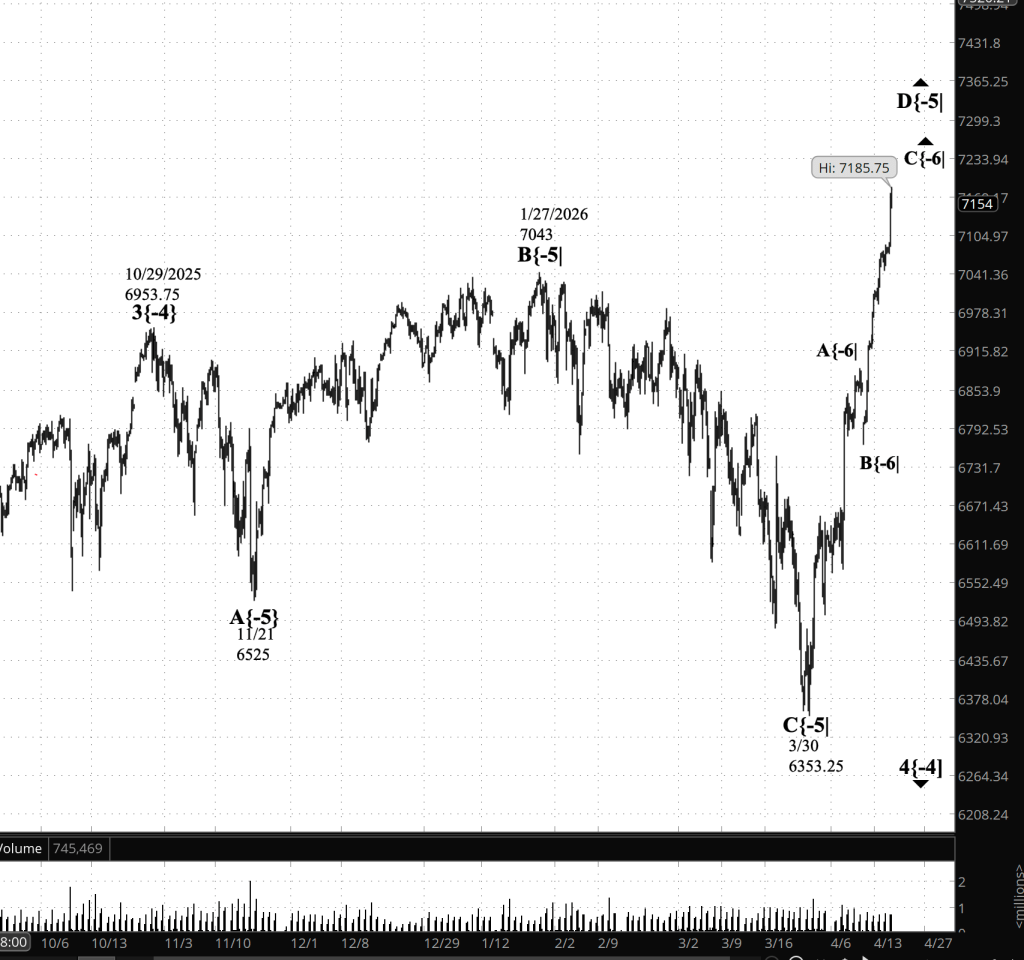
[S&P 500 E-mini futures at 3:30 p.m., 4-hour bars with volume]
Waves Now Underway
These are the waves currently in progress under my principal analysis. Each line on the list shows the wave number, with the subscript in curly brackets, the traditional degree name, the starting date, the starting price of the S&P 500 E-mini futures, and the direction of the wave.
- S&P 500 Index:
- 5{+3} Supercycle, 7/8/1932, 4.40 (up)
- 5{+2} Cycle, 12/9/1974, 60.96 (up)
- 5{+1} Primary, 3/6/2009, 666.79 (up)
- 5{0} Intermediate, 2/11/2016, 1810.10 (up)
- 3{-1} Minor, 3/23/2020, 2191.36 (up)
- 1{-2} Minute, 7/31/2025, 6468.50 (down)
- S&P 500 E-mini futures
- 5{-3} Minuette 8/1/2025, 6239.50 (up}
- 4{-4} Subminutte 10/29/2025, 6953.75 (down}
- D{-5} Micro, 3/30/2026, 6353.25 (up}
- C{-6} (none), 4/1/2026, 6767 (up)
Reading the chart. Price movements — waves – – in Elliott Wave Theory analysis are labeled with numbers within trending waves and letters with corrective waves. The subscripts — numbers in curly brackets — designate the wave’s degree, which, in Elliott Wave analysis, means the relative position of a wave within the larger and smaller structures that make up the chart. R.N. Elliott, who in the 1930s developed the form of analysis that bears his name, viewed the chart as a complex structure of smaller waves nested within larger waves, which in turn are nested within still larger waves. In mathematics it’s called a fractal structure, where at every scale the pattern is similar to the others.
Learning and other resources. Elliott Wave analysis provides context, not prophecy. As the 20th century semanticist Alfred Korzybski put it in his book Science and Sanity (1933), “The map is not the territory … The only usefulness of a map depends on similarity of structure between the empirical world and the map.” And I would add, in the ever-changing markets, we can judge that similarity of structure only after the fact.
See the menu page Analytical Methods for a rundown on where to go for information on Elliott Wave analysis.
By Tim Bovee, Portland, Oregon, April 17, 2026
Disclaimer
Tim Bovee, Private Trader tracks the analysis and trades of a private trader for his own accounts. Nothing in this blog constitutes a recommendation to buy or sell stocks, options or any other financial instrument. The only purpose of this blog is to provide education and entertainment.
No trader is ever 100 percent successful in his or her trades. Trading in the stock and option markets is risky and uncertain. Each trader must make trading decisions for his or her own account, and take responsibility for the consequences.
All content on Tim Bovee, Private Trader by Timothy K. Bovee is licensed under a Creative Commons Attribution-ShareAlike 4.0 International License.
Based on work at www.timbovee.com

You must be logged in to post a comment.